
This article was originally published on gamblingreform.co.uk on 21st August 2023. Click here to download a pdf of the report.
Key Findings
Full Report
1. Introduction
In this paper we examine how likely 5 different types of gamblers are to be asked for the Enhanced Financial Risk Checks (EFRCs) outlined in the Government White Paper.
The white paper suggested that operators are required to ask customers for EFRCs if they lose £1,000 in a day or £2,000 over a rolling 90 day period.
We use simulation modelling to examine the losses and likelihood of EFRCs being imposed on Owners, Form Students, Racing Enthusiasts, Accumulator Punters and Roulette Players.
We found that gamblers who prefer to bet in a well-considered manner, less often on lower margin products with higher stakes were far more likely to be asked for EFRCs than gamblers who bet more frequently with lower stakes. We also found that the gamblers who bet more frequently with lower stakes were more likely to sustain bigger losses over a longer period.
2. The Proposals in the Gambling White Paper and Gambling Commission Consultation
The Department for Culture, Media and Sport published its White Paper ‘High Stakes: Gambling Reform for the Digital Age’ in April 2023.
The paper stated that they wanted ‘obligations on operators to conduct checks to understand if a customer’s gambling is likely to be unaffordable and harmful.’
The proposal was for two types of ‘financial risk’ checks:
- Background checks for a loss of £125 in a month or £500 in a year. They would check for financial vulnerabilities such as CCJs.
- Enhanced checks at £1,000 net loss in a day (‘binge gambling’) or £2000 net loss over 90 days (‘sustained losses over time’).
The values are halved for customers aged 18 to 24.
The paper made several further comments:
- The enhanced checks would only affect 3% of online gambling accounts.
- Intention for checks to be frictionless through open banking and/or credit reference agencies.
- Further information should only be requested as a last resort.
- Where there are serious concerns operators should share information.
- ‘..it is not the intent that government or the Gambling Commission should set a blanket rule on how much of their
The Gambling Commission published its consultation document containing the financial risk checks in July 2023.
The background credit checks proposed are the same as the White Paper for £500 a year or £125 in a month losses.
For ‘binge gambling’ additional detail was added that a positive net position for the last 7 days could be taken into account. This means that if a gambler is on a good run in the last week they can gamble beyond the £1,000 loss limit for a day without checks. But beyond the 7 days previous wins are excluded from calculations. These checks would need to be repeated in six months if the £1000 daily threshold is reached again.
The ‘sustained losses over time’ checks are required if £2,000 is lost in a rolling 90 day period. These checks would also need to be repeated in six months if the £2,000 90 day threshold is reached again.
For the £1,000 and £2,000 checks, lifetime position of the account may not be taken into account or winnings from another operator when deciding to do a check.
Bets staked only contribute to the checks once they are settled as a loser.
The proposals state for £1,000 and £2,000 checks licensees must obtain credit performance data and; income and expenditure, including current account turnover data. Using this information and other information they know about the client they must manually make a decision to take proportionate action if risk is identified. The long term position of the account can be taken into account at this stage.
The Gambling Commission estimated 3.2% of betting accounts (1,000,000 accounts) would need an enhanced assessment for the £2,000 losses in 90 days. They also stated 2% of accounts would need to be assessed for 1 day losses of £1,000. It is important to note that many of the same accounts are going to cross both thresholds.
3. Different Types of Gamblers For Modelling
Five different types of gamblers were chosen to test if and when they would be subject to Enhanced Financial Risk Checks (EFRC).
Table 1 - Parameters for Each Gambler Type Simulated
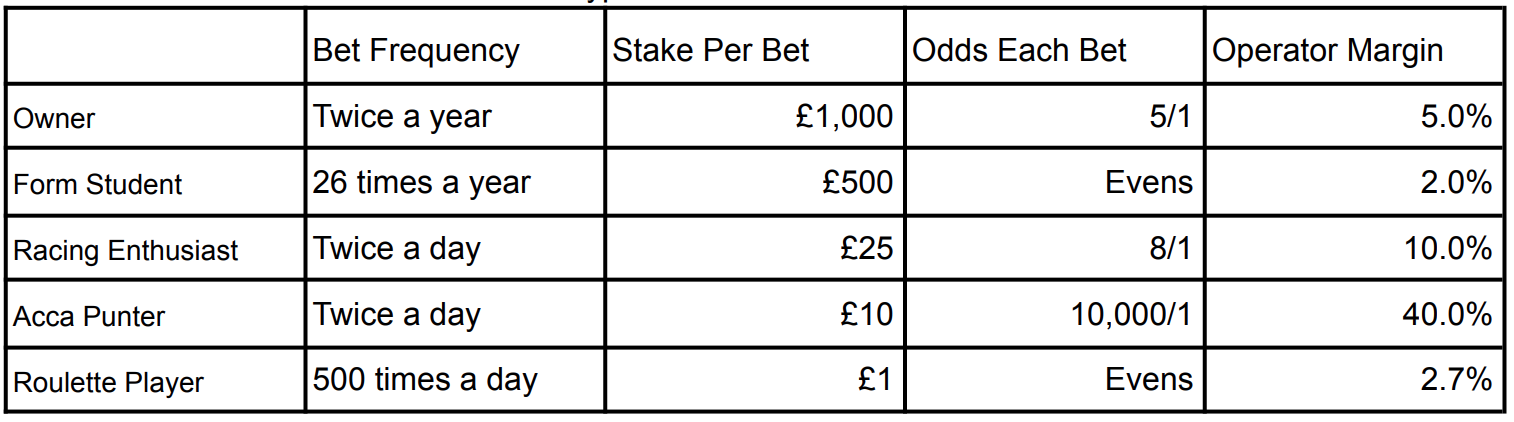
Table 1 summarises each type of gambler.
Gambler 1 is a racehorse owner. He likes to bet £1,000 on his own horses twice a year at 5/1.
Gambler 2 is a serious form student. She is extremely selective with her selections betting £500 once every 2 weeks with a win single on an even money shot.
Gambler 3 is a racing enthusiast. He likes to place two win single bets a day of £25 on his best selections. They are always priced at 8/1.
Gambler 4 loves to bet on racing accumulators dreaming of a big win. Every day she bets £10 on two 4 horse accumulators. The accas are priced at 10,000/1.
Gambler 5 enjoys playing roulette. Everyday he bets £1 on 500 spins on red at even money.
4. The Simulation Model
The five customer types were run through simulation code. Each cohort was given 10,000 ‘customers accounts’ running the simulation 10,000 times. Each simulation run was for a fixed amount of time. We tested for 6 months, 1 year, 2 years, 3 years and 5 years. Every bet was simulated using a random number to determine the outcome. Results were stored for each worst single day (to check if £1,000 was lost) and rolling for every 90 days (to check if £2,000 was lost). The code for the simulation is in the Appendix of the full report.
5. Results Summary
Table 2 - Average Profit and Chance of Being asking for EFRC by Gambler Type
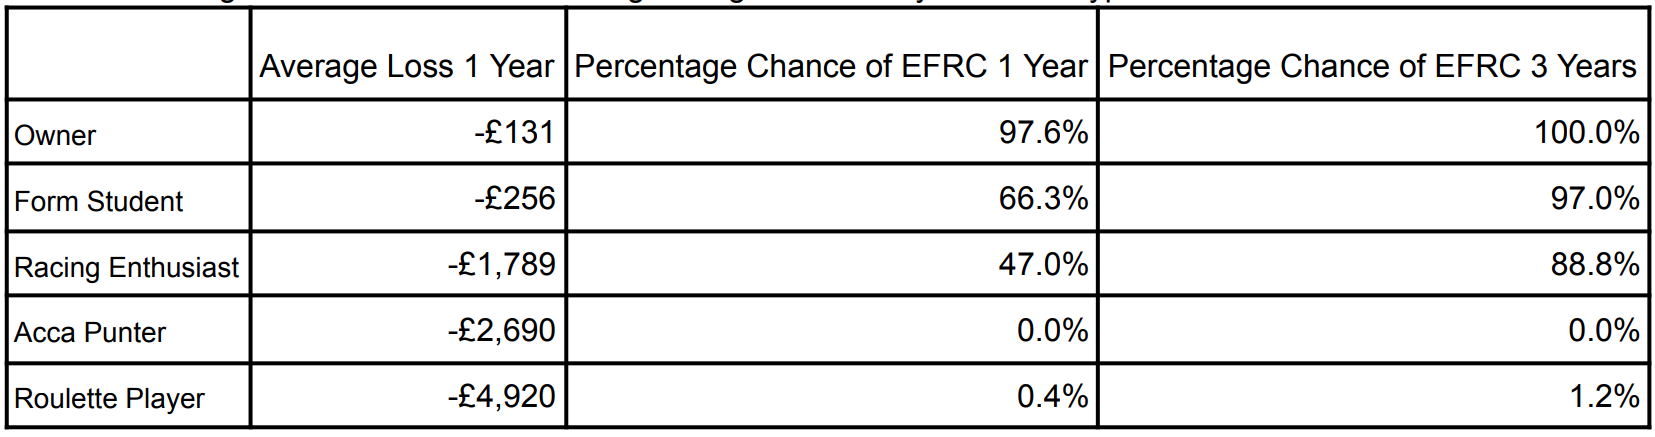
The owners have the lowest annual average annual loss of £131. 98% of these owners will have been asked for an EFRC within the first year. This is due to the request to have a £1,000 bet and that being regarded as binge gambling if the bet loses.
The Form Student has an average loss of £256 and a 66% chance of being asked for an EFRC in year 1 up to 97% by the end of year 3. The Racing Enthusiast placing 2 £25 win singles a day is next with an 89% chance of being asked for an EFRC within 3 years.
The Acca Punter and Roulette Player have the biggest average losses. They are also both extremely unlikely to be asked for an EFRC. The Acca Punter only stakes £20 a day (£1,800 in 90 days) keeping her under the £2,000 threshold at all times meaning no EFRC requests. The Roulette Player stakes £500 a day (£18,000 in 90 days) but bets with high frequency and low average stakes keeping his betting variance over 90 days very low. It is just steady losses for him through time resulting in an average loss of £4,920 over the year.
6. Detailed Results Analysis
6.1. Gambler 1 - Owner
The owner places a £1,000 bet on one of his own horses at 5/1 every 183 days. We have assumed the margin in favour of the betting operator on those bets is 5%.
Table 3 - Owner Average Loss and Chance of EFRC Through Time
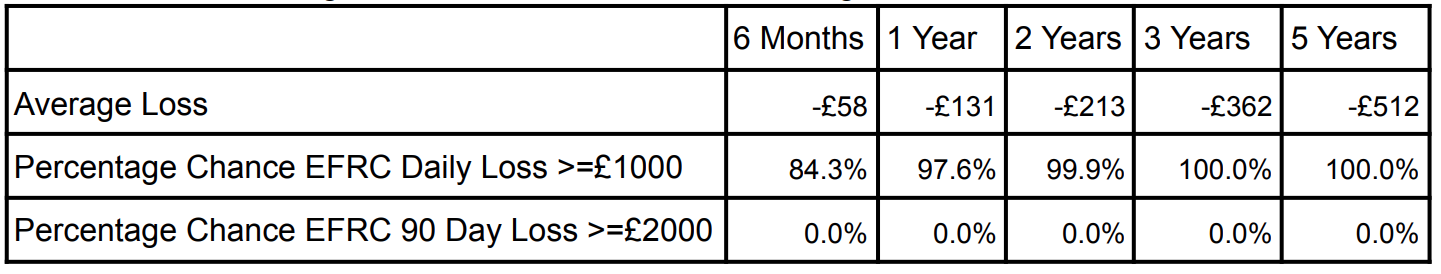
Table 3 shows that in the simulation 100% of owners were asked for an EFRC by year 3. This is because as soon as the owner loses a bet he is required to do an EFRC. It is only a matter of time before that happens. The owner never places more than £1000 over a rolling 90 day period so has no chance of being required to do the £2000 checks.
Table 4 - Owners Average Win By Win Percentage Through Time
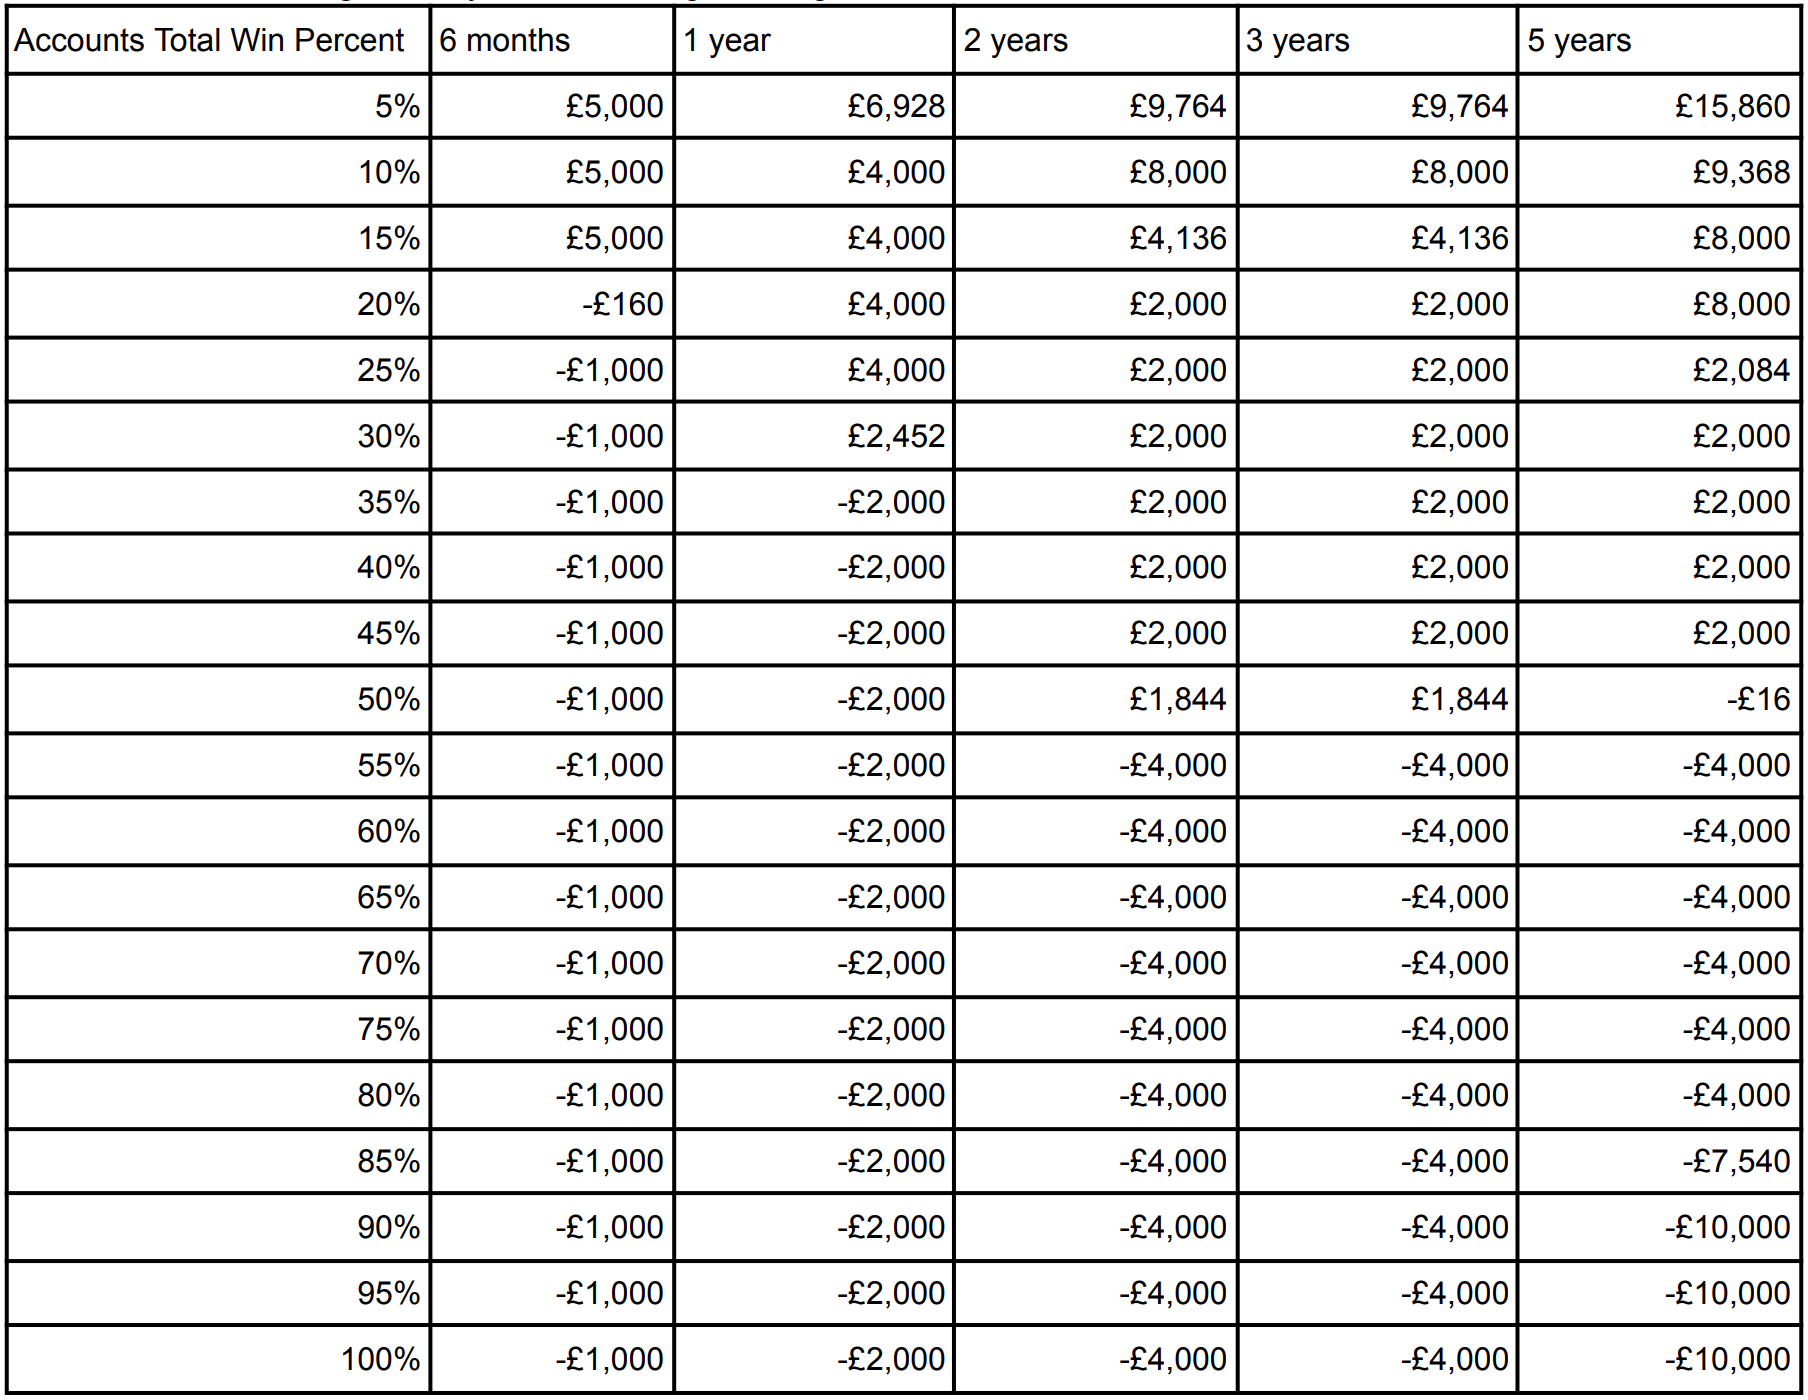
Table 4 shows the split between winning and losing owners in the 10,000 sample. The top 5% of accounts by profitability won an average of £15,860 over 5 years. The worst 15% of accounts lost £10,000. They lost every bet of 2 bets of £1000 a year for 5 years.
In Year 1 only 15% of owners made a profit and by Year 5 five this metric was up to 45%. This shows how mean reversion impacts high stakes low volume gambling through the randomness of results.
6.2. Gambler 2 - Form Student
The Form Student places a £500 bet on a well studied selection at even money every 14 days. We have assumed the margin in favour of the betting operator on those bets 2%. It is lower than the owner because the form student has more skill in her selections and the operator margin is generally lower for short price picks.
Table 5 - Form Student Average Loss and Chance of EFRC Through Time
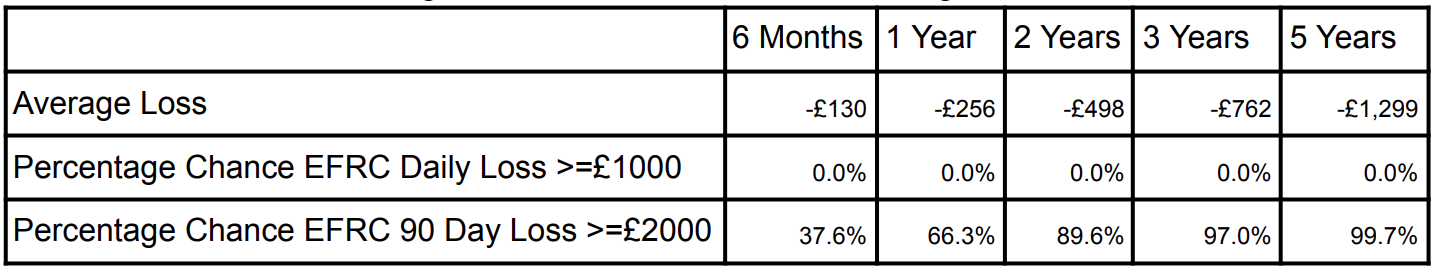
Table 5 shows that in the simulation 97% of form students were asked for an EFRC by year 3. The average loss was around £250 a year.
Table 6 - Form Student Average Win By Win Percentage Through Time
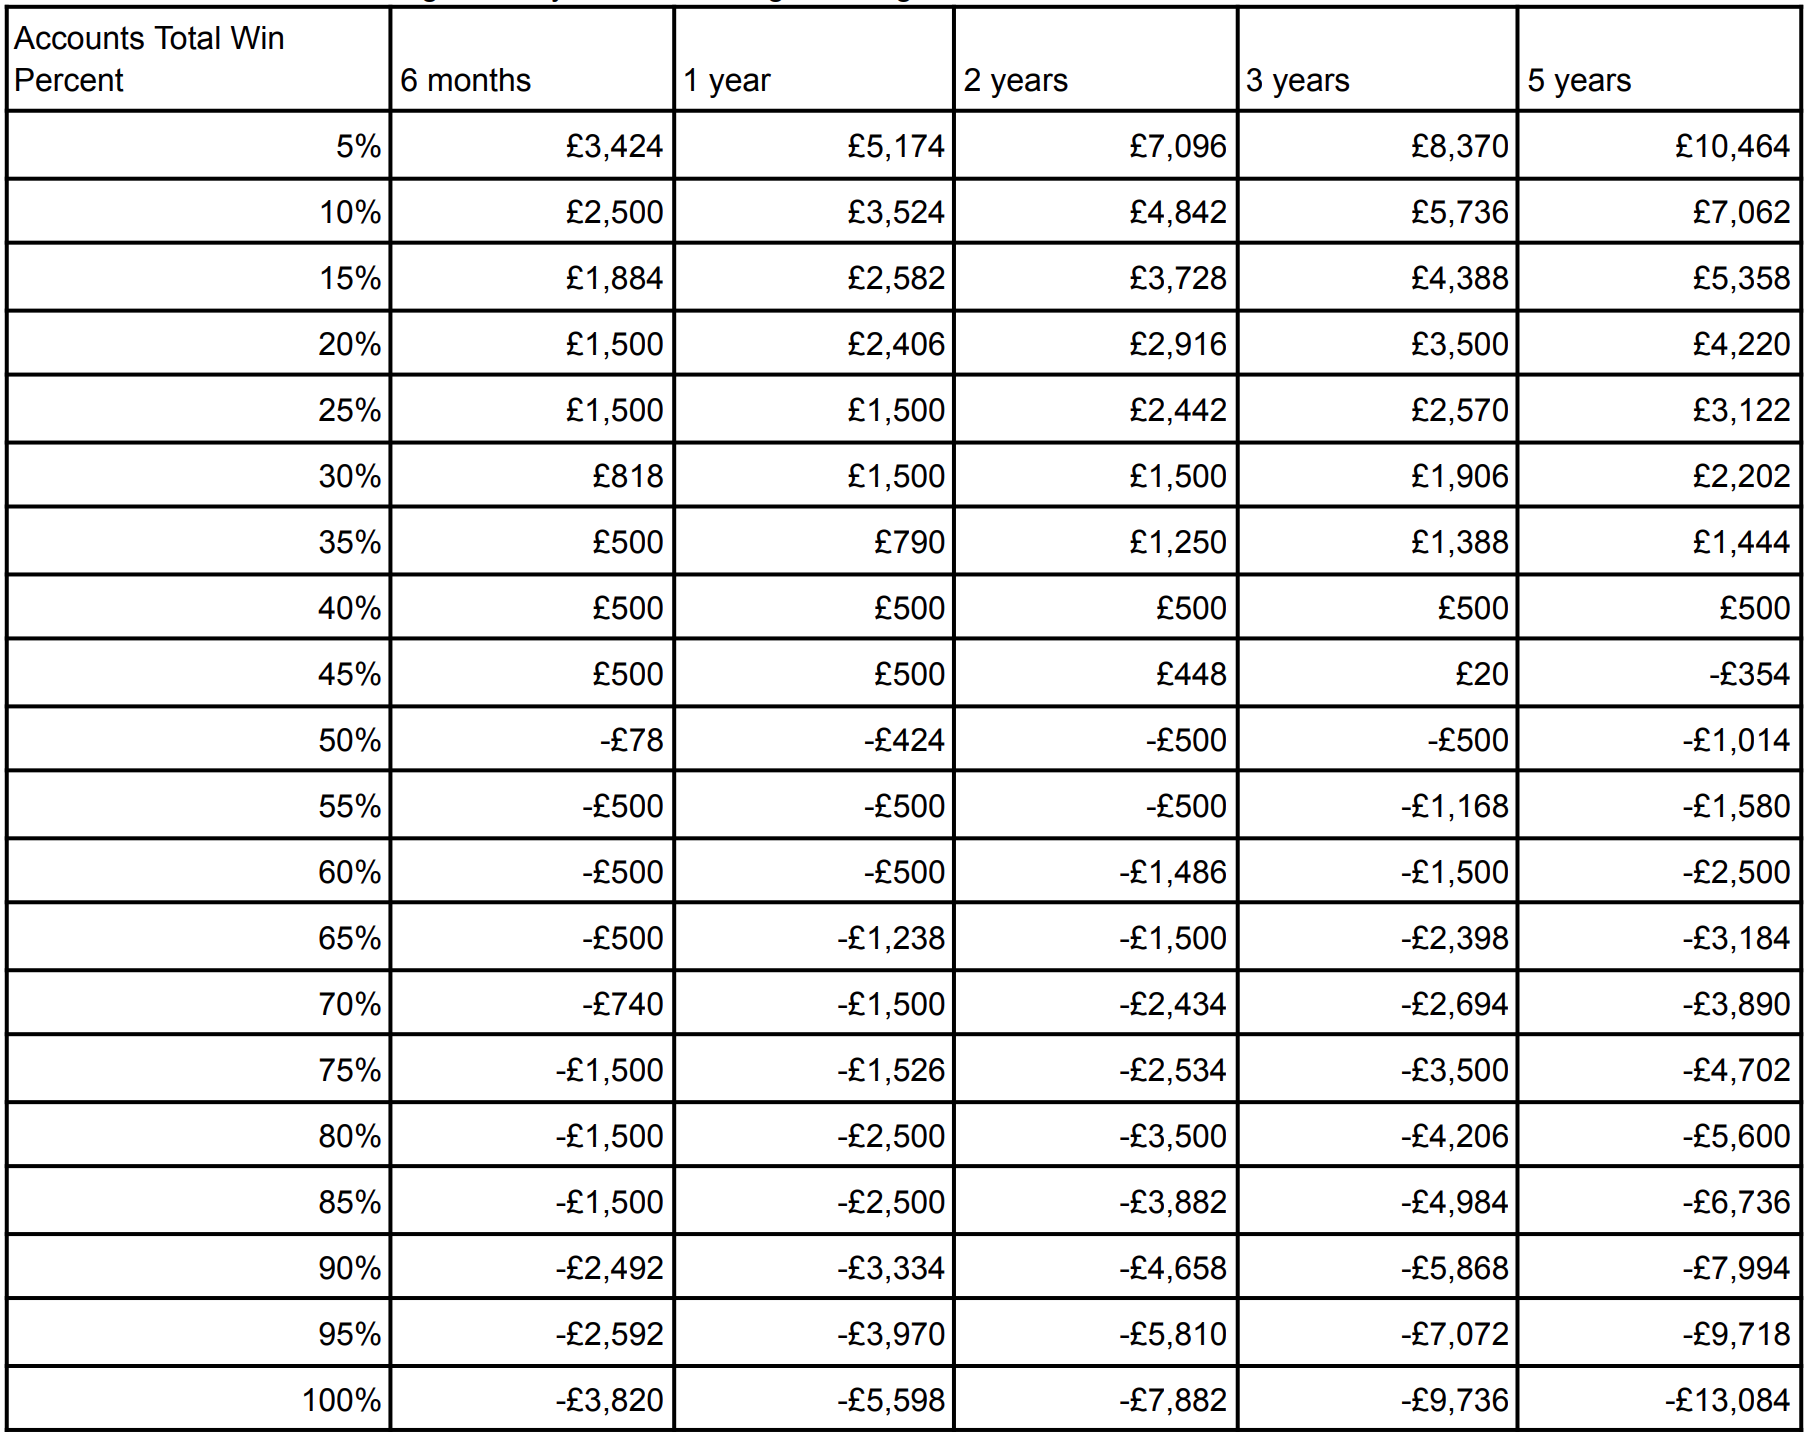
Table 6 shows the split between winning and losing form students in the 10,000 sample. The top 5% of accounts by profitability won an average of £10,464 over 5 years. The worst 5% of accounts lost £13,084 in 5 years. 45% of accounts had made a profit in the first 3 years yet 90% of accounts had been asked to do an EFRC in that time.
Chart 1 - Example of Form Student Rolling Profit and Loss Over 3 Years
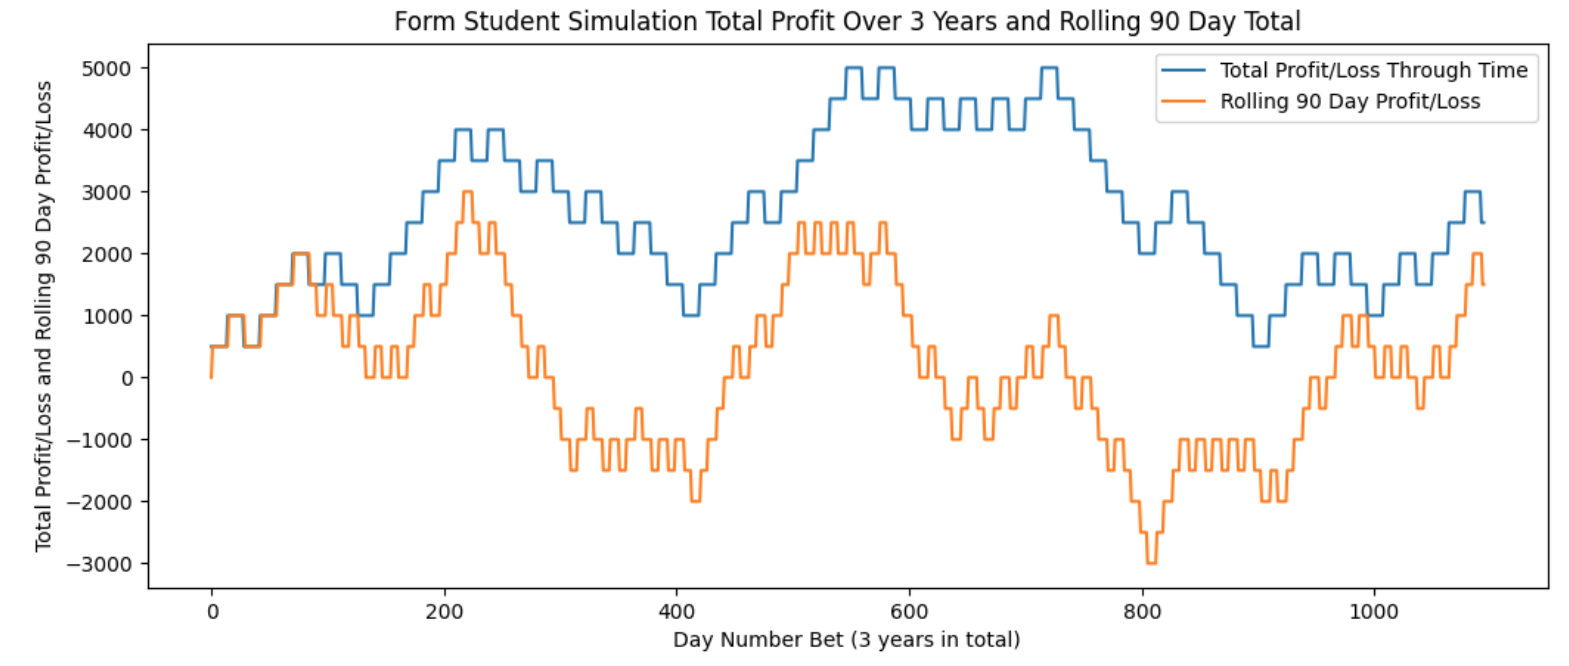
Chart 1 shows an example of a simulated form student. The blue line is the cumulative profit and loss. The orange line represents the rolling 90 day profit and loss. Despite always being in profit the form student would be asked for EFRC checks at 409 days and 802 days due to a random bad run of results. At both points she was over £1,500 in profit overall.
6.3. Gambler 3 - Racing Enthusiast
The Racing Enthusiast places £25 bets on his two best selections of the day at 8/1. We have assumed the margin in favour of the betting operator on those bets of 10%.
Table 7 - Racing Enthusiast Average Loss and Chance of EFRC Through Time
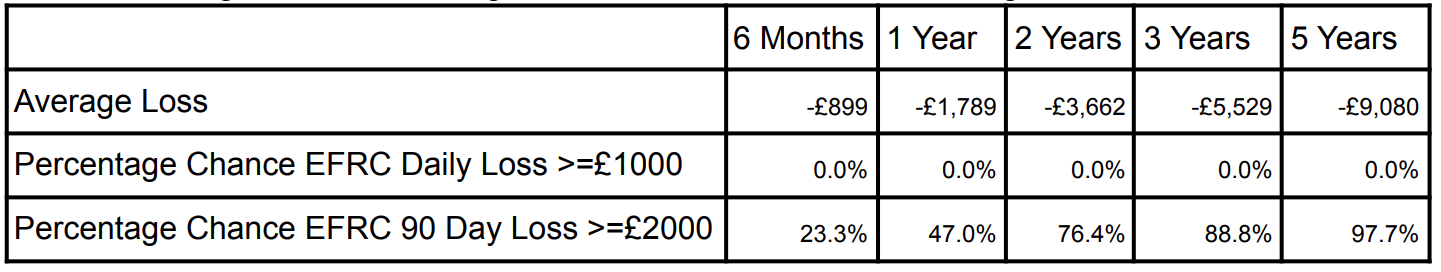
Table 7 shows that in the simulation 76% of racing enthusiasts were asked for an EFRC by year 3. The average loss was around £1,800 a year or £5 a day.
Table 8 shows the split between winning and losing racing enthusiasts in the 10,000 sample. The top 25% of accounts by profitability won in the first 6 months. But after 5 years all of the accounts had lost money ranging from between £508 and £17,288.
Table 8 - Racing Enthusiast Average Win By Win Percentage Through Time
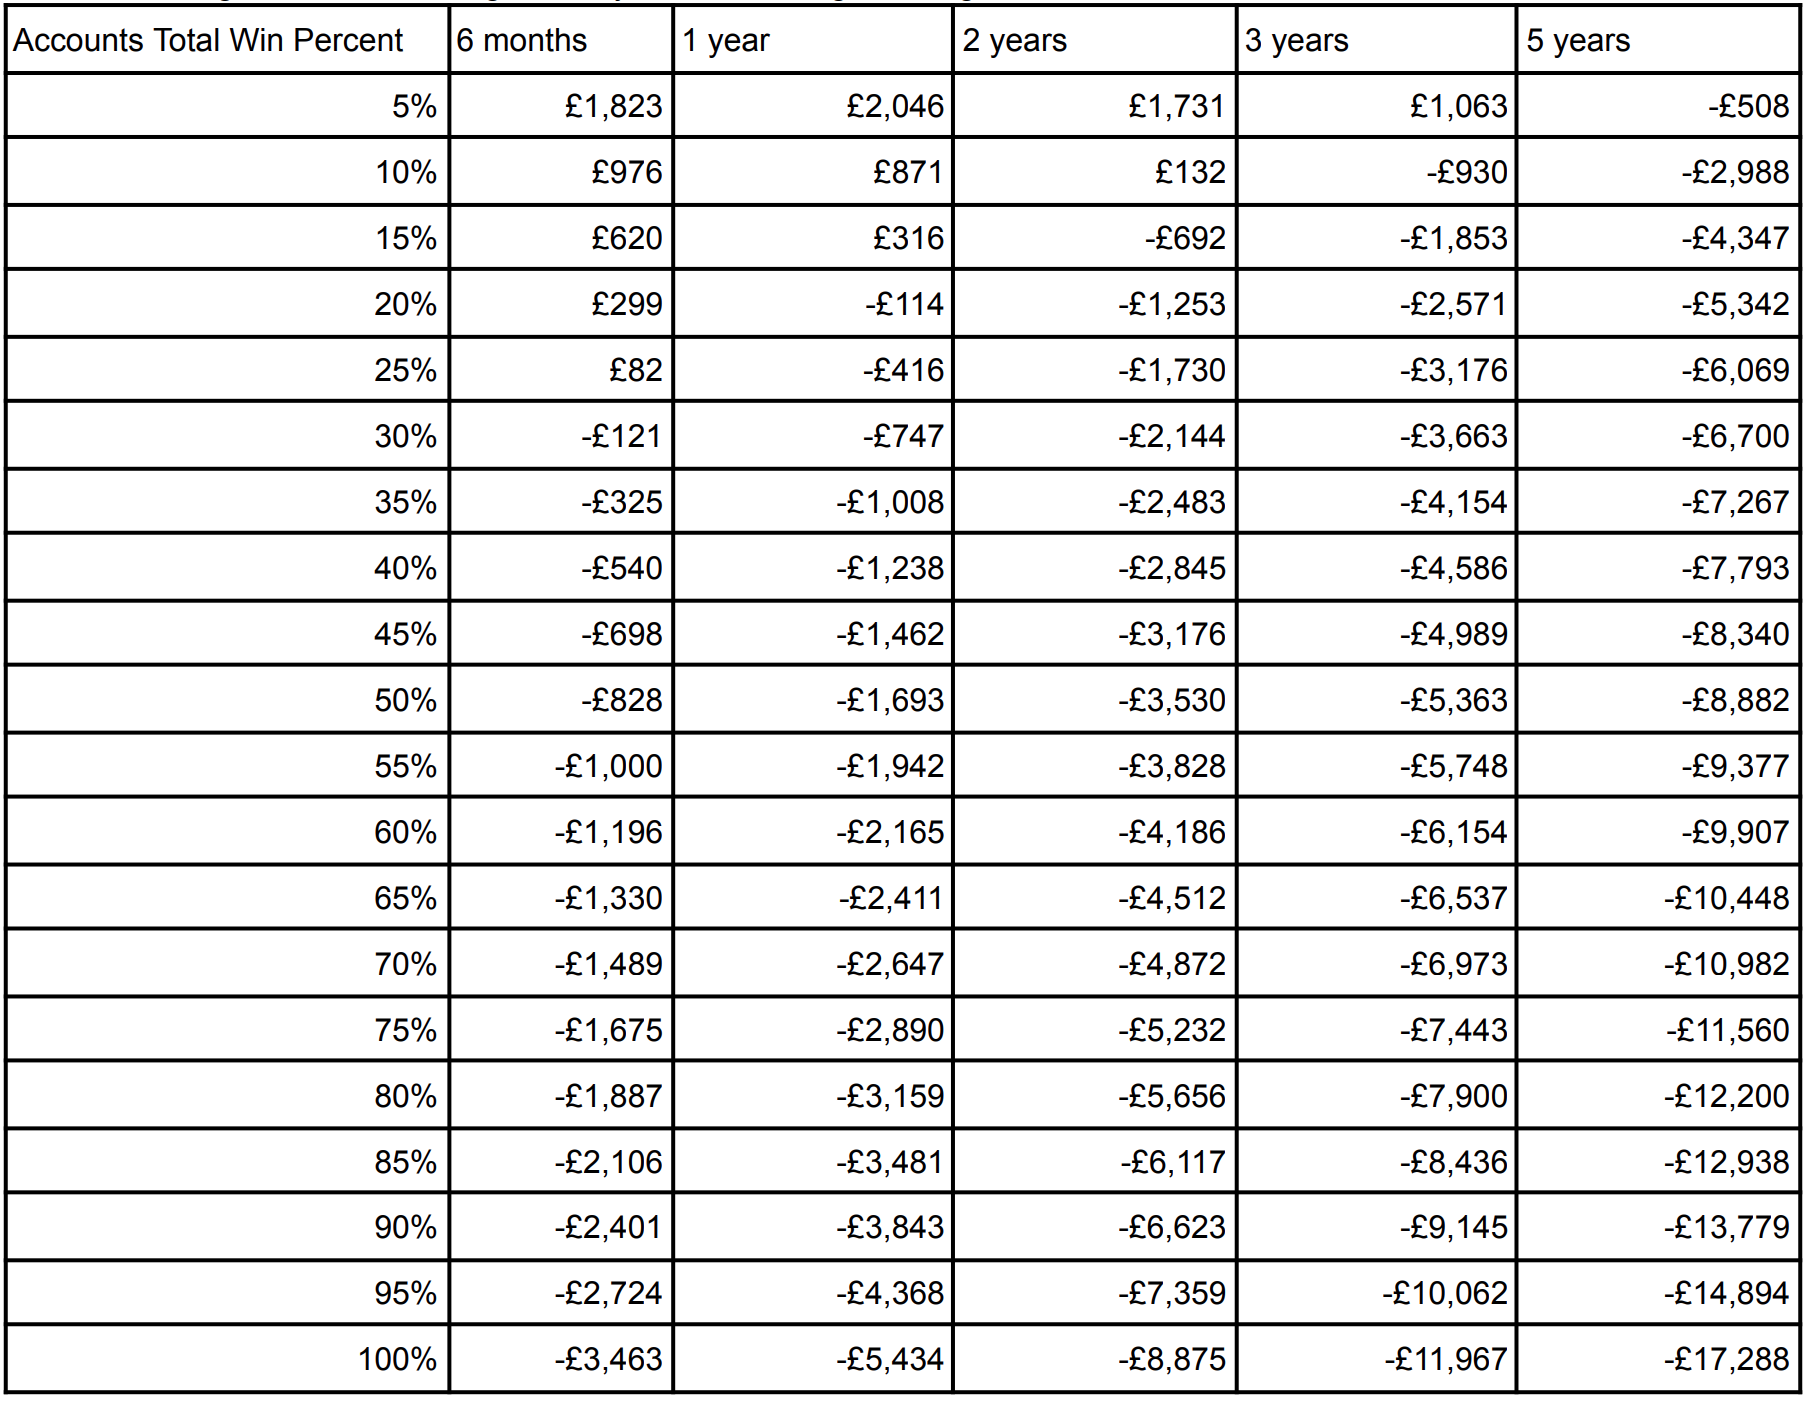
Chart 2 - Example of Racing Enthusiast Rolling Profit and Loss Over 3 Years
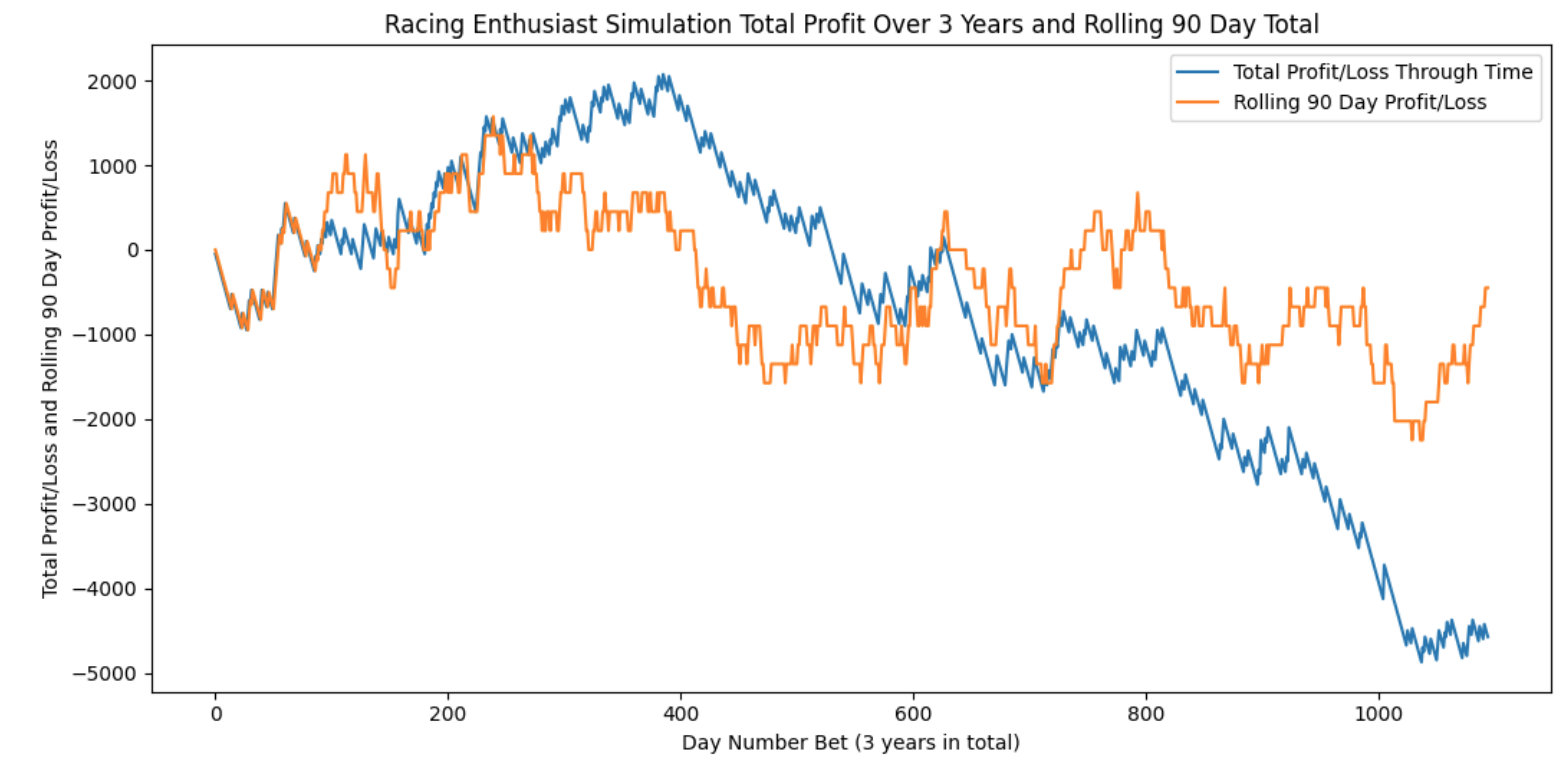
Chart 2 shows an example of a simulated racing enthusiast. The blue line is the cumulative profit and loss. The orange line represents the rolling 90 day profit and loss. Despite losing steadily since day number 400 it was not until the gambler was almost £5,000 down that the EFRC was requested for losing £2,000 over a 90 day period.
6.4. Gambler 4 - Acca Punter
The Acca Punter places £10 bets on two 4 horse accumulators everyday. The total odds for each accumulator is 10,000/1. We have assumed the margin in favour of the betting operator on those bets of 40%.
Table 9 - Acca Punter Average Loss and Chance of EFRC Through Time
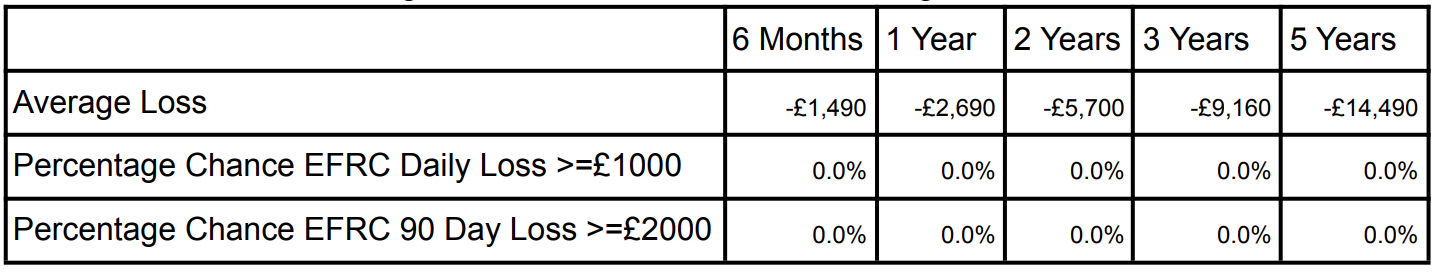
Table 9 shows that the Acca Punter was never asked for an EFRC. This is because she always bet £20 a day. This means a total maximum loss over 90 days of £1,800 which is under the threshold for EFRCs. She lost on average £2,690 a year.
Table 10 shows the split between winning and losing racing enthusiasts in the 10,000 sample. The top 5% of accounts by profitability won in the 1st year rising to 20% in the 5th year as more of the sample won a 10,000/1 acca bet. 95% of accounts lost £7,300 in the first year with no EFRC checks.
Table 10 - Acca Punter Average Win By Win Percentage Through Time
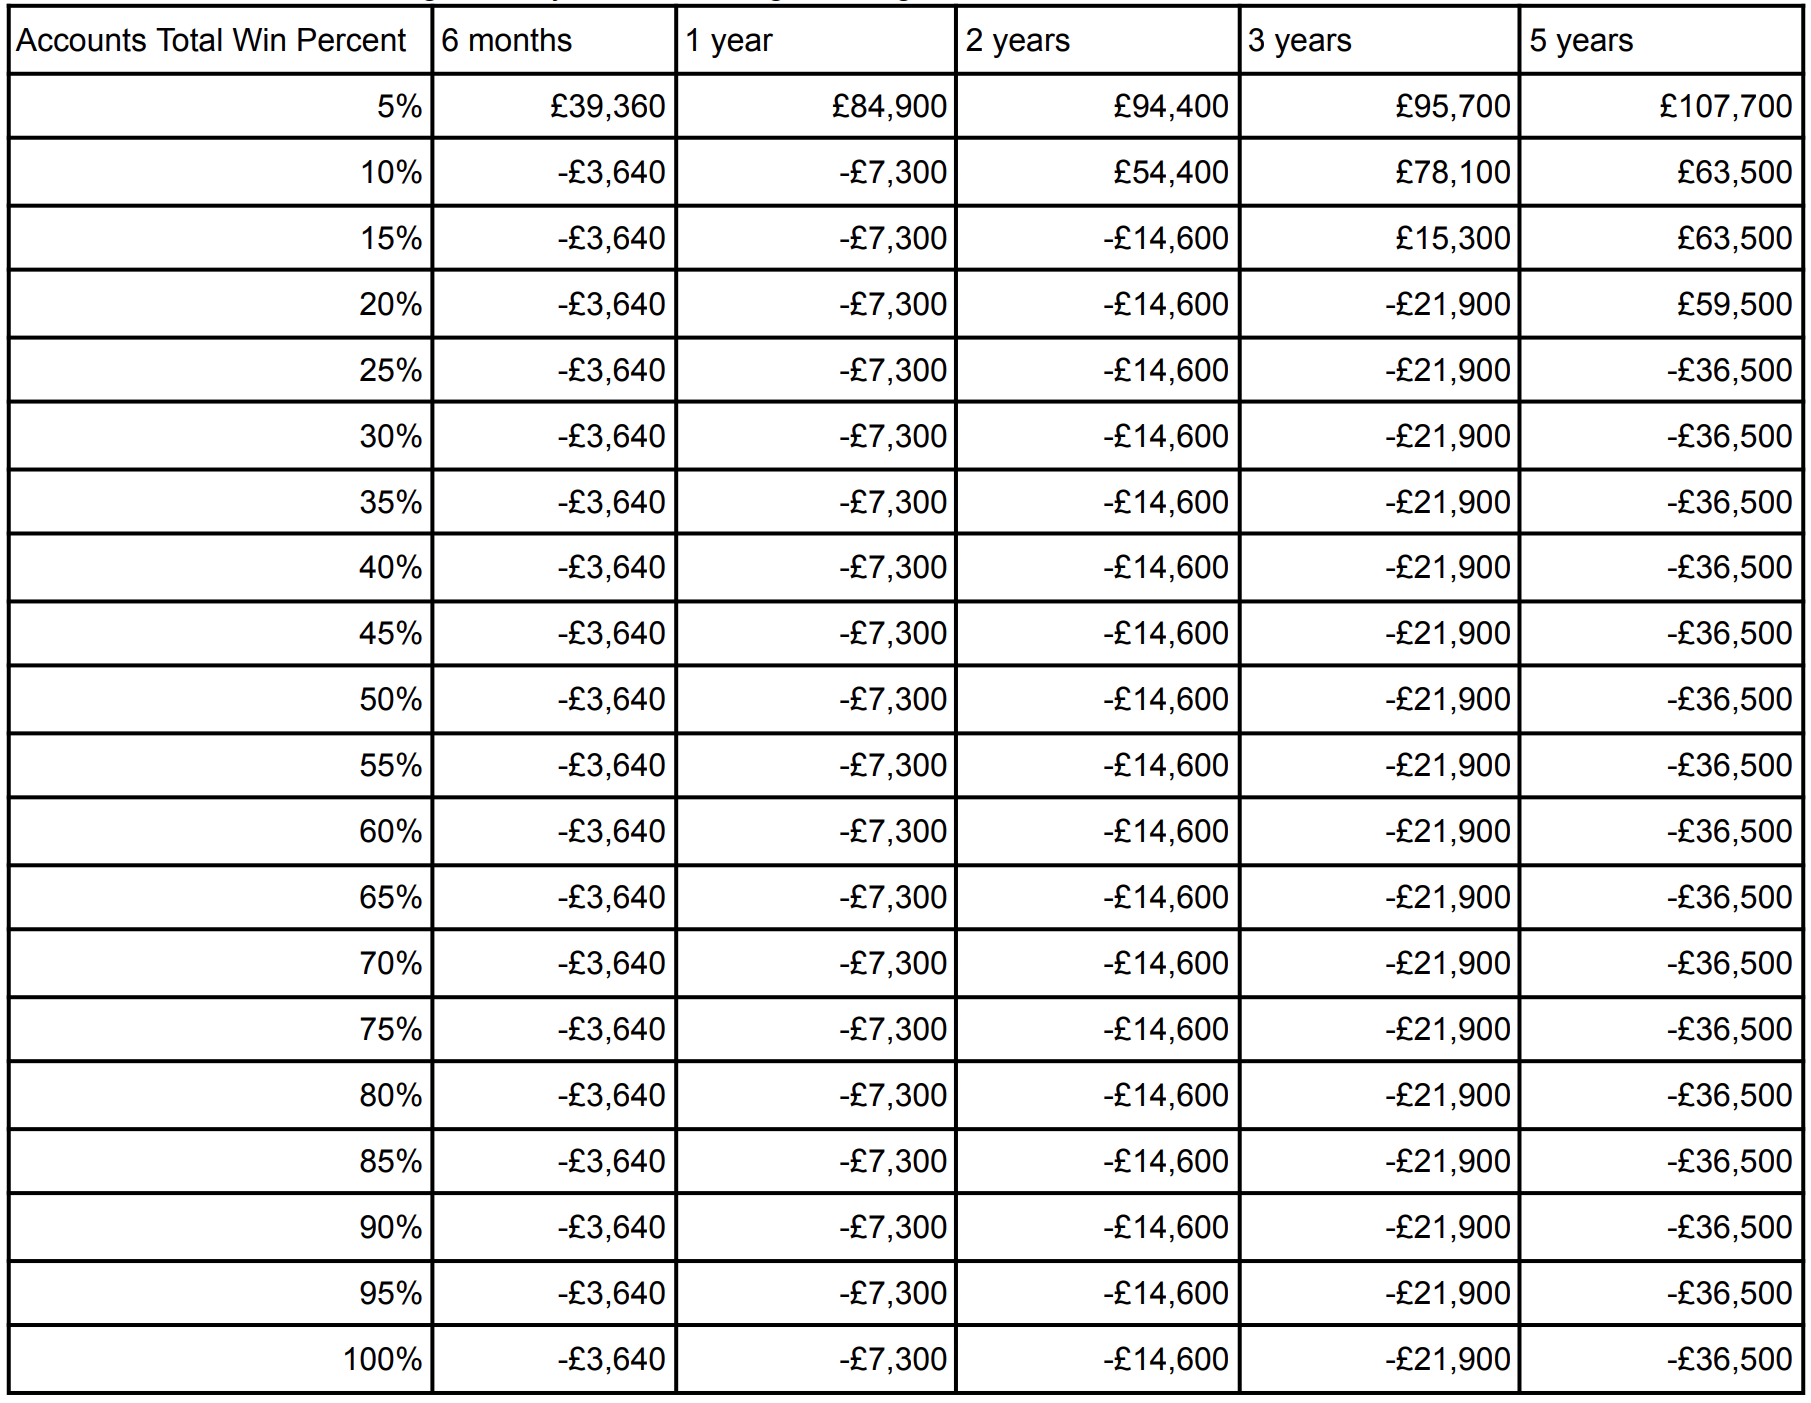
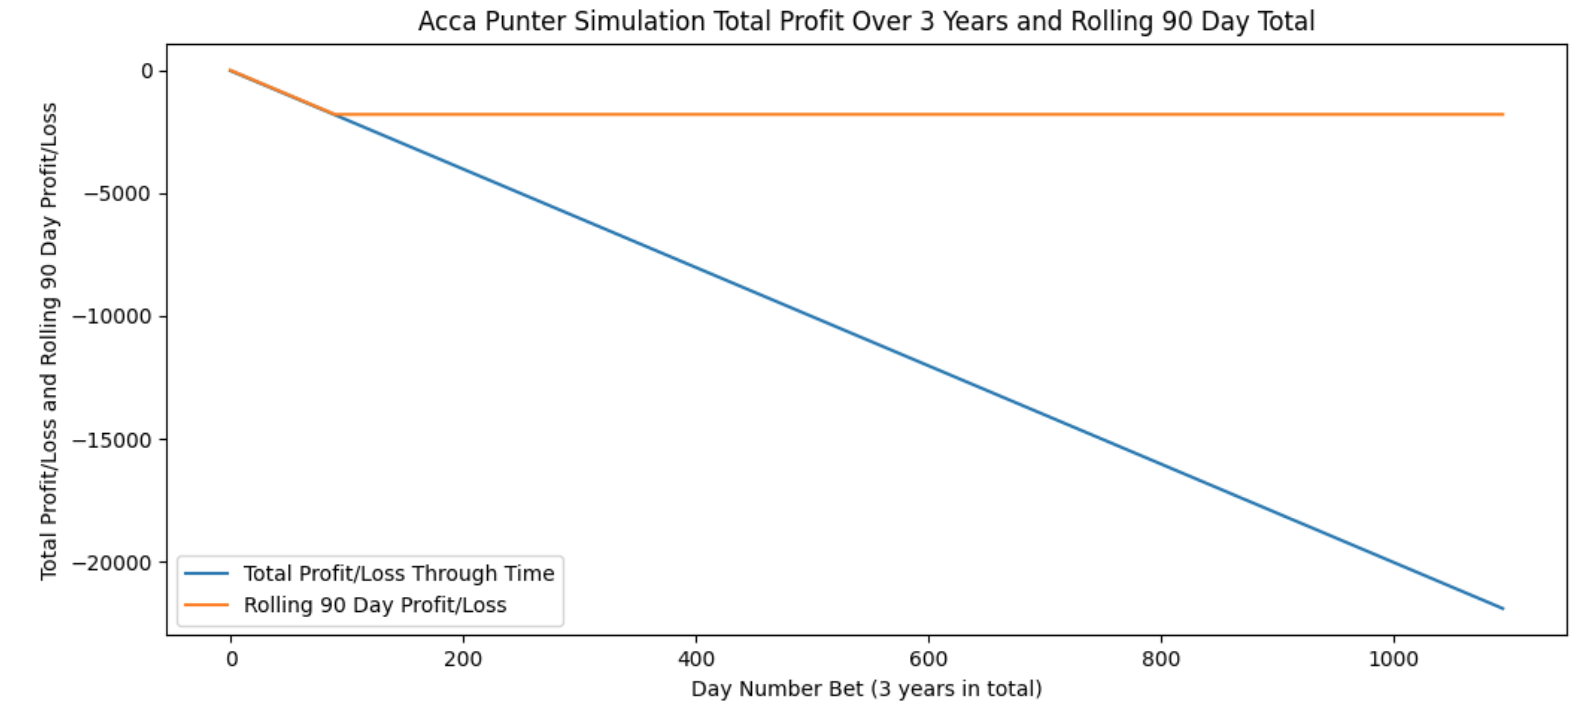
Chart 3 shows an example of a simulated Acca Punter. She lost £20 a day for 3 years, never winning the 10,000/1 accumulator. The orange line shows the rolling 90 day total always on a £1800 loss.
Chart 3 - Example of Acca Punter Rolling Profit and Loss Over 3 Years
6.5. Gambler 5 - Roulette Player
The Roulette Player places £1 bets on red 500 times a day. The odds to win each spin at even money with a 2.7% house margin.
Table 11 - Roulette Player Average Loss and Chance of EFRC Through Time
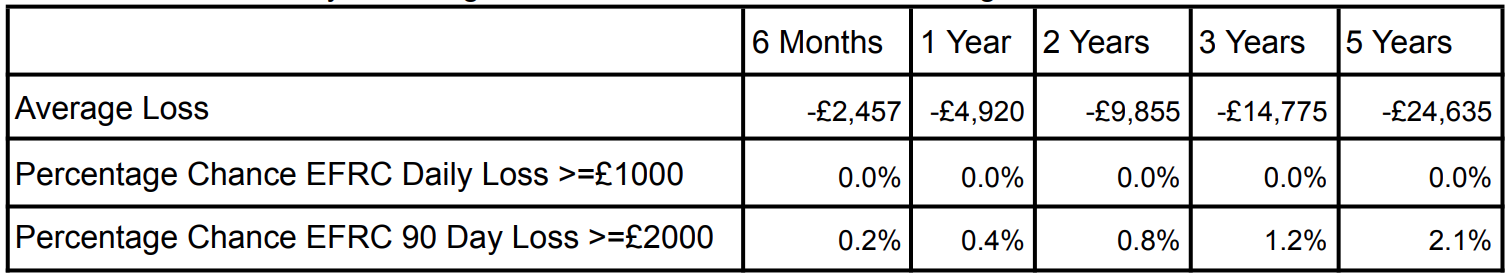
Table 11 shows that the roulette player lost an average of around £5,000 a year. The percentage of players asked for EFRCs was extremely low starting at 0.4% in Year 1 up to 2.1% after 5 years.
Table 12 shows that even the top 5% of roulette players lost. The range in the first year was between £4,055 and £5,801.
Table 12 - Roulette Player Average Win By Win Percentage Through Time
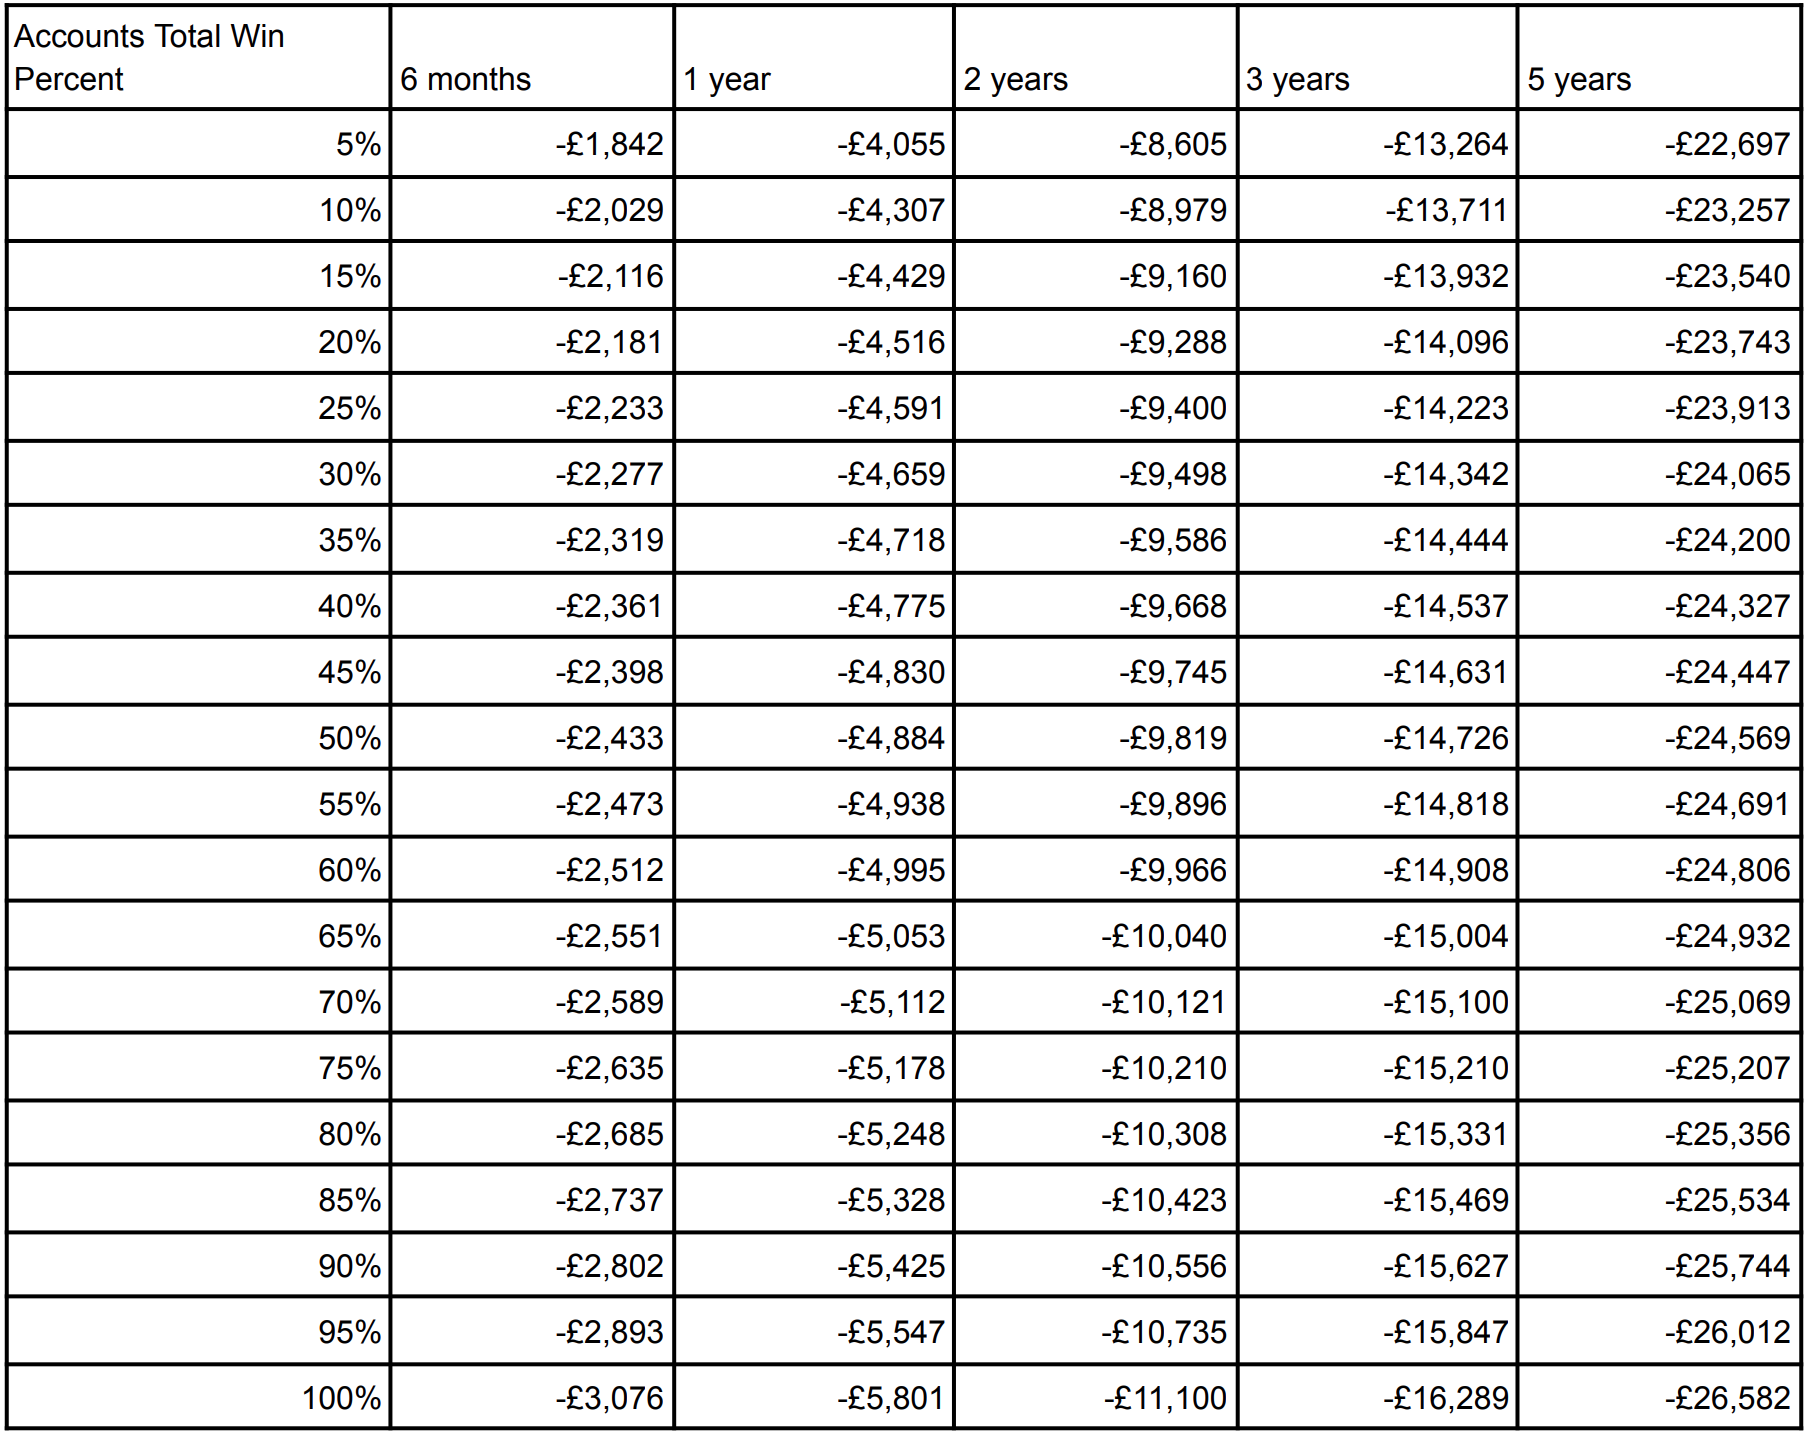
Chart 4 - Example of Roulette Player Rolling Profit and Loss Over 3 Years
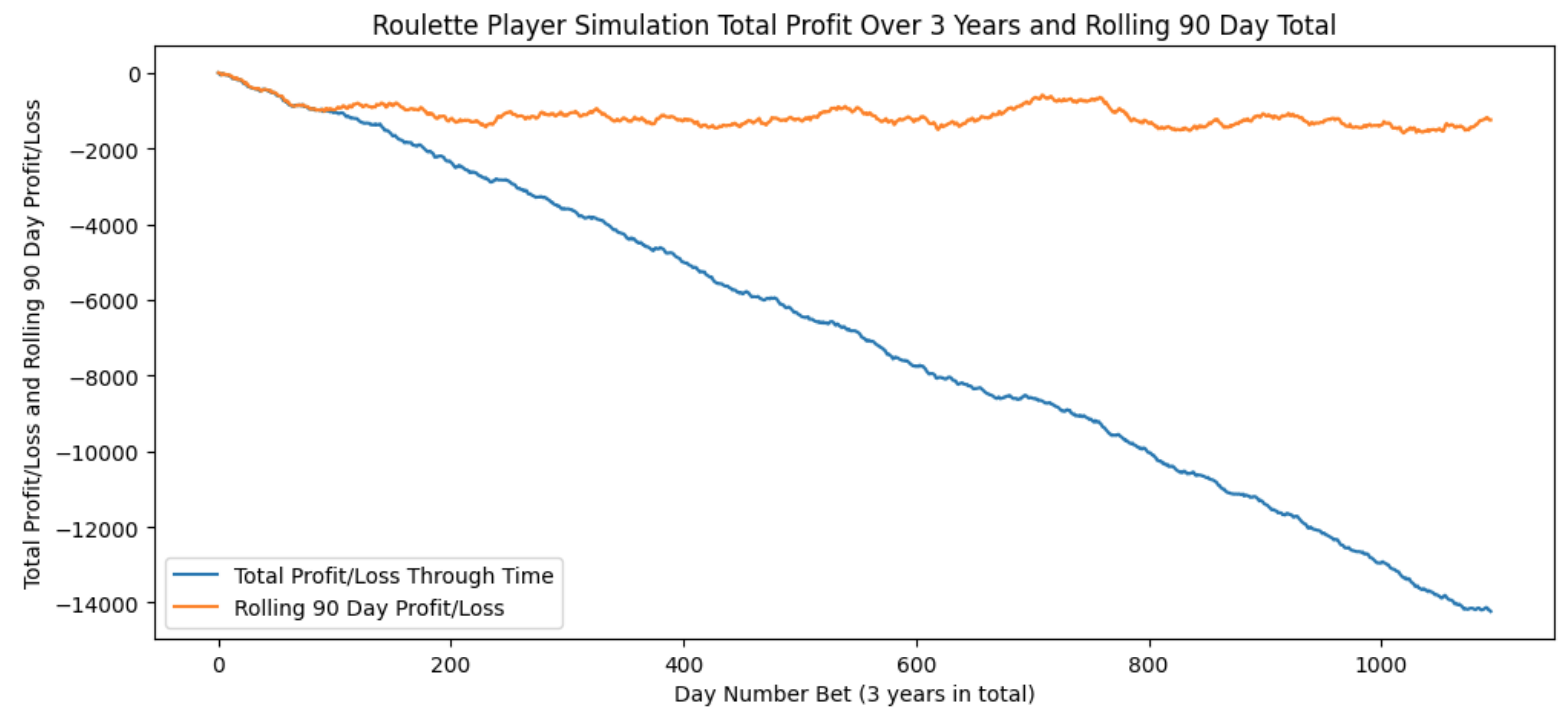
Chart 4 shows an example of a simulated Roulette Player. The orange line always remains above the £2,000 loss line despite £500 a day being bet on roulette. The losses are consistent due to the high number of low stake/low margin bets being placed.
7. Conclusion
The simulation models used in this paper have shown that proposed EFRCs on losses of £1,000 daily or £2,000 over 90 days are not fit for their intended purpose.
They would require the occasional gambler who wishes to have a large stake, well-considered bet to be checked whilst leaving lower staking more risky gamblers to bet freely.
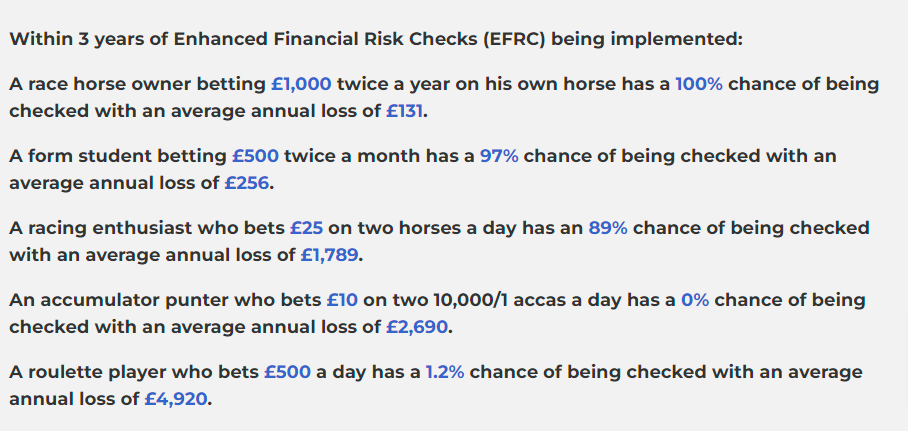
A gambler playing roulette staking £500 a day is extremely unlikely to ever get requested for an EFRC whereas a horse racing gambler betting £500 on a well-considered win single every 2 weeks has a 97% chance of being checked within 3 years. The roulette gambler would incur average losses of £4,920 a year whereas the racing gambler’s losses would average just £256.
The roulette player could incur these losses undetected on up to 100 licenced British websites potentially racking up hundreds of thousands of losses a year. Conversely, the more considered gambler would eventually be shut down by all operators if he or she refused to provide information for EFRCs.